Tidy Tuesday 13/08/2019 Roman Emperors
Data description
From From TidyTuesdays github:
Information about Roman emperors such as their birth date and place, reign start and end, death cause and others.
Import data and packages
library(tidyverse)
library(treemapify)
# emperors <- readr::read_csv("https://raw.githubusercontent.com/rfordatascience/tidytuesday/master/data/2019/2019-08-13/emperors.csv")
# readr::write_csv(emperors, "emperors.csv")
emperors <- readr::read_csv("emperors.csv")
Data
Since it’s a small dataset, I’ll look it with Rstudio Viewer.
#View(emperors)
str(emperors, give.attr = FALSE)
## Classes 'spec_tbl_df', 'tbl_df', 'tbl' and 'data.frame': 68 obs. of  16 variables:
##  $ index      : num  1 2 3 4 5 6 7 8 9 10 ...
##  $ name       : chr  "Augustus" "Tiberius" "Caligula" "Claudius" ...
##  $ name_full  : chr  "IMPERATOR CAESAR DIVI FILIVS AVGVSTVS" "TIBERIVS CAESAR DIVI AVGVSTI FILIVS AVGVSTVS" "GAIVS IVLIVS CAESAR AVGVSTVS GERMANICVS" "TIBERIVS CLAVDIVS CAESAR AVGVSTVS GERMANICVS" ...
##  $ birth      : Date, format: "0062-09-23" "0041-11-16" ...
##  $ death      : Date, format: "0014-08-19" "0037-03-16" ...
##  $ birth_cty  : chr  "Rome" "Rome" "Antitum" "Lugdunum" ...
##  $ birth_prv  : chr  "Italia" "Italia" "Italia" "Gallia Lugdunensis" ...
##  $ rise       : chr  "Birthright" "Birthright" "Birthright" "Birthright" ...
##  $ reign_start: Date, format: "0026-01-16" "0014-09-18" ...
##  $ reign_end  : Date, format: "0014-08-19" "0037-03-16" ...
##  $ cause      : chr  "Assassination" "Assassination" "Assassination" "Assassination" ...
##  $ killer     : chr  "Wife" "Other Emperor" "Senate" "Wife" ...
##  $ dynasty    : chr  "Julio-Claudian" "Julio-Claudian" "Julio-Claudian" "Julio-Claudian" ...
##  $ era        : chr  "Principate" "Principate" "Principate" "Principate" ...
##  $ notes      : chr  "birth, reign.start are BCE. Assign negative for correct ISO 8601 dates. Cause may have been Natural" "birth is BCE. Assign negative for correct ISO 8601 dates. Possibly assassinated by praetorian guard" "assassination may have only involved the Praetorian Guard" "birth is BCE. Assign negative for correct ISO 8601 dates." ...
##  $ verif_who  : chr  "Reddit user zonination" "Reddit user zonination" "Reddit user zonination" "Reddit user zonination" ...
Most of the data is date or categorical. I’m curious about how many different death causes and killers we have.
emperors_ck <- emperors %>%
  transmute(cause = factor(cause),
         killer = factor(killer))

summary(emperors_ck)
##             cause                 killer
##  Assassination :25   Other Emperor   :18
##  Captivity     : 1   Disease         :16
##  Died in Battle: 5   Praetorian Guard: 7
##  Execution     : 8   Opposing Army   : 6
##  Natural Causes:21   Own Army        : 5
##  Suicide       : 5   Unknown         : 5
##  Unknown       : 3   (Other)         :11
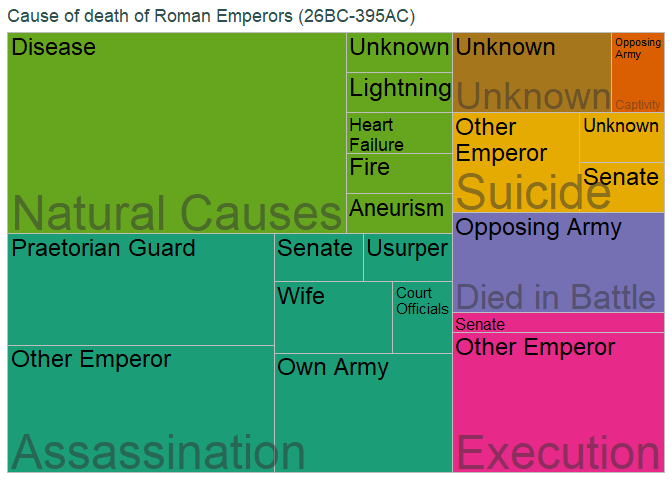
So we have just 7 death causes and some varied killer motives, so I can create a treemap to display this information.
Creating a data frame with the relevant information for the treemap.
emperors_ck <- emperors_ck %>%
  transmute(parent = cause,
            id = killer) %>%
  group_by(parent, id) %>%
  summarise(value = n())
Creating the treemap with treemapify package.
ggplot(emperors_ck, aes(area = value, fill = parent,
                        label = id, subgroup = parent))+
  geom_treemap() +
  geom_treemap_text(place = 'topleft', min.size = 8,
                    reflow = T) +
  geom_treemap_subgroup_text(
    alpha = 0.5, place = 'bottomleft'
  ) +
  scale_fill_brewer(palette = 'Dark2') +
  theme(
    legend.position = 'none',
    title = element_text(colour = 'darkslategrey')
  ) +
  labs(title = 'Cause of death of Roman Emperors (26BC-395AC)')