Tidy Tuesday 12/11/2019 Code in CRAN Packages
Data description
From From TidyTuesdays github:
This week’s data is from the CRAN courtesy of Phillip Massicotte.
He analyzed the lines of code and the different languages in all of the R packages on CRAN.
Packages and data reading
library(tidyverse)

cran_code <- readr::read_csv("https://raw.githubusercontent.com/rfordatascience/tidytuesday/master/data/2019/2019-11-12/loc_cran_packages.csv")
Quick look
cran_code %>% glimpse()
## Observations: 34,477
## Variables: 7
## $ file     <dbl> 2, 1, 23, 3, 30, 5, 1, 11, 10, 16, 6, 2, 1, 6, 15, 7, 1…
## $ language <chr> "R", "HTML", "R", "HTML", "R", "Markdown", "HTML", "R",…
## $ blank    <dbl> 96, 347, 63, 307, 224, 246, 26, 32, 104, 153, 101, 60, …
## $ comment  <dbl> 353, 5, 325, 9, 636, 0, 1, 202, 333, 62, 330, 46, 0, 0,…
## $ code     <dbl> 365, 2661, 676, 1275, 587, 418, 190, 141, 406, 882, 294…
## $ pkg_name <chr> "A3", "aaSEA", "aaSEA", "abbyyR", "abbyyR", "abbyyR", "…
## $ version  <chr> "1.0.0", "1.0.0", "1.0.0", "0.5.5", "0.5.5", "0.5.5", "…
Only one version of the packages?
cran_code %>%
  select(pkg_name, version) %>%
  distinct() %>%
  group_by(pkg_name) %>%
  count(version) %>%
  filter(n>1)
## # A tibble: 0 x 3
## # … with 3 variables: pkg_name <chr>, version <chr>, n <int>
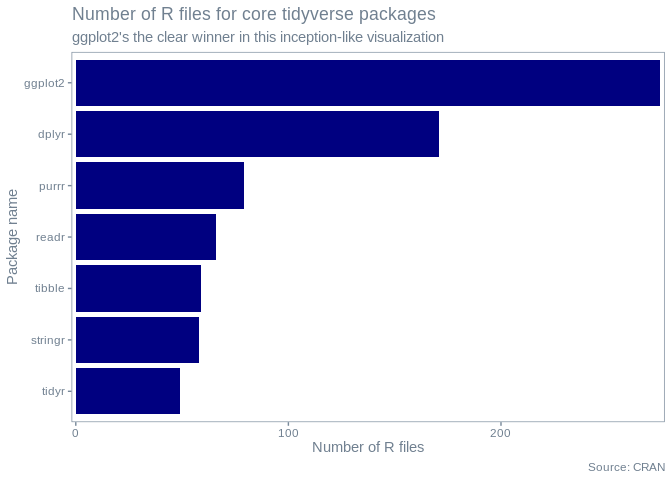
With this out of our way I think I’ll look into the tidyverse packages.
cran_code %>%
  filter(
    pkg_name %in% c(
      "ggplot2",
      "dplyr",
      "tidyr",
      "readr",
      "purrr",
      "tibble",
      "stringr",
      "focats"
    ),
    language == "R"
  ) %>%
  count(pkg_name, wt = file, sort = TRUE) %>%
  mutate(pkg_name = fct_reorder(pkg_name, n)) %>%
  ggplot(aes(pkg_name, n)) +
  geom_col(fill = "navyblue") +
  scale_y_continuous(expand = c(0,2)) +
  labs(
    title = "Number of R files for core tidyverse packages",
    subtitle = "ggplot2's the clear winner in this inception-like visualization",
    caption = "Source: CRAN",
    x = "Package name",
    y = "Number of R files"
  ) +
  coord_flip() +
  theme_bw() +
  theme(panel.grid.major = element_blank(),
        panel.grid.minor = element_blank(),
        strip.background = element_blank(),
        strip.placement = 'outside',
        panel.border = element_rect(color = 'lightslategrey'),
        title = element_text(colour = "slategrey"),
        strip.text = element_text(color = 'slategrey'),
        axis.ticks = element_line(color = 'lightslategrey'),
        axis.text = element_text(color = 'slategrey'))