Tidy Tuesday 10/09/2019 Amusement Park
Data description
From From TidyTuesdays github:
This week’s data is from data.world and the Safer Parks database.
A lot of free text this week, some inconsistent NAs (n/a, N/A) and dates (ymd, dmy). A good chance to do some data cleaning and then take a look at frequency, type of injury, and analyze free text.
Additional data can be found at SaferParks Database
Import data and packages
library(tidyverse)
library(waffle)

library(tidytext)
library(wordcloud)

tx_injuries <- readr::read_csv("https://raw.githubusercontent.com/rfordatascience/tidytuesday/master/data/2019/2019-09-10/tx_injuries.csv")

safer_parks <- readr::read_csv("https://raw.githubusercontent.com/rfordatascience/tidytuesday/master/data/2019/2019-09-10/saferparks.csv")
Look at data
safer_parks %>% glimpse()
## Observations: 8,351
## Variables: 23
## $ acc_id               <dbl> 1005813, 1004032, 1007658, 1007098, 10000...
## $ acc_date             <chr> "6/12/2010", "6/12/2010", "7/10/2010", "7...
## $ acc_state            <chr> "OH", "OH", "CA", "CA", "CO", "WI", "WI",...
## $ acc_city             <chr> "Cleveland", "Cleveland", "Anaheim", "Car...
## $ fix_port             <chr> "F", "P", "F", "F", "F", "F", "P", "F", "...
## $ source               <chr> "Ohio Dept. of Agriculture", "United Stat...
## $ bus_type             <chr> "Sports or recreation facility", "Sports ...
## $ industry_sector      <chr> "recreation", "recreation", "amusement ri...
## $ device_category      <chr> "inflatable", "inflatable", "water ride",...
## $ device_type          <chr> "Inflatable slide", "Inflatable slide", "...
## $ tradename_or_generic <chr> "inflatable slide", "inflatable slide", "...
## $ manufacturer         <chr> "Scherba Industries / Inflatable Images",...
## $ num_injured          <dbl> 9, 8, 1, 1, 1, 1, 1, 20, 1, 1, 2, 1, 1, 1...
## $ age_youngest         <dbl> NA, 54, 37, 37, NA, 12, 16, NA, 14, NA, 1...
## $ gender               <chr> NA, "M", "F", "F", "M", "F", "F", NA, "M"...
## $ acc_desc             <chr> "Inflatable slide tipped over while 7-9 p...
## $ injury_desc          <chr> "The man who was crushed by the device di...
## $ report               <chr> "https://saferparksdata.org/sites/default...
## $ category             <chr> "Device tipped over, blew away, or collap...
## $ mechanical           <dbl> NA, NA, NA, NA, 1, NA, 1, NA, NA, NA, 1, ...
## $ op_error             <dbl> 1, 1, NA, NA, NA, 1, NA, 1, NA, NA, NA, N...
## $ employee             <dbl> NA, NA, NA, NA, NA, NA, NA, NA, NA, NA, N...
## $ notes                <chr> "http://www.cleveland.com/metro/index.ssf...
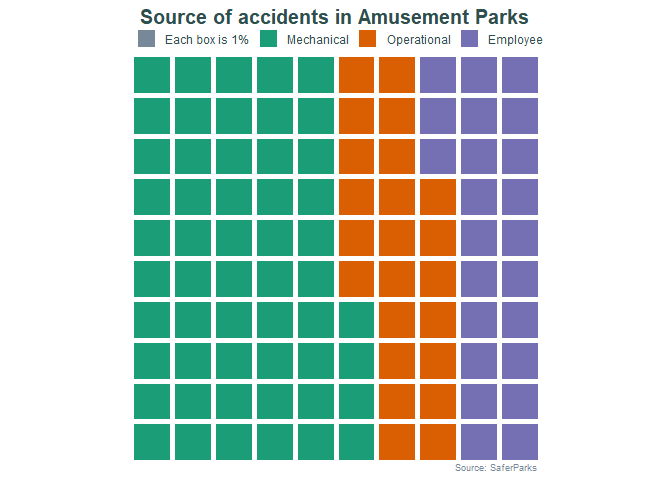
Looking at the Source of accidents.
(p <- safer_parks %>%
  summarise(
    mech_count = sum(mechanical, na.rm = TRUE),
    op_error_count = sum(op_error, na.rm = TRUE),
    emp_count = sum(op_error, na.rm = TRUE)
  ) %>%
  transmute(
    total = sum(mech_count, op_error_count, emp_count),
    `Each box is 1%` = 0,
    Mechanical = round(mech_count/total, digits = 2)*100,
    Operational = round(op_error_count/total, digits = 2)*100,
    Employee = round(emp_count/total, digits = 2)*100,
  ) %>%
  select(-total) %>%
  waffle(title = "Source of accidents in Amusement Parks",
         colors = c("lightslategrey" , "#1b9e77",
                    "#d95f02", "#7570b3")) +
   labs(caption = "Source: SaferParks ") +
   theme(plot.title = element_text(size = 15,
                                  face = "bold",
                                  color = "darkslategrey",
                                  margin = margin(0,0,0,0,'pt'),
                                  hjust = 0.45),
        legend.position = "top",
        legend.margin = margin(0,0,0,0,'pt'),
        legend.spacing = margin(0,0,0,0,'pt'),
        legend.box.spacing = margin(0,1,1,1,'pt'),
        plot.caption = element_text(size = 7,
                                    color = "lightslategrey",
                                    margin = margin(0,0,0,0,'pt')),
        legend.text = element_text(color = "darkslategrey")
        ))
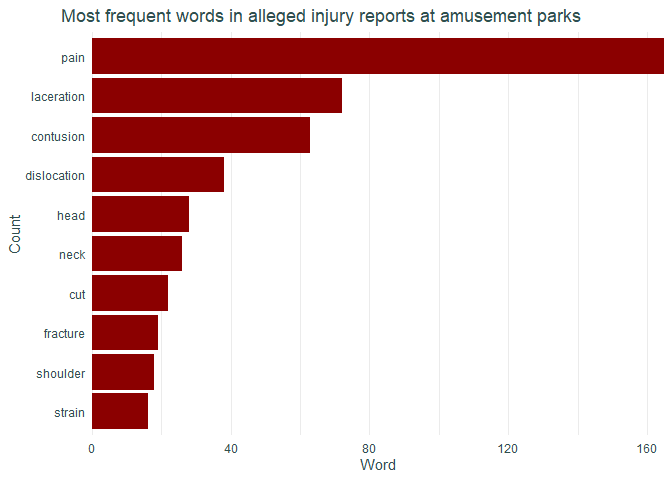
Now looking at the free test to see the most frequent words of the alleged injury reports
tx_injuries %>% glimpse()
## Observations: 542
## Variables: 13
## $ injury_report_rec <dbl> 2032, 1897, 837, 99, 55, 780, 253, 253, 55, ...
## $ name_of_operation <chr> "Skygroup Investments LLC DBA iFly Austin", ...
## $ city              <chr> "Austin", "Galveston", "Grapevine", "San Ant...
## $ st                <chr> "TX", "TX", "TX", "TX", "AZ", "TX", "TX", "T...
## $ injury_date       <chr> "2/12/2013", "3/2/2013", "3/3/2013", "3/3/20...
## $ ride_name         <chr> "I Fly", "Gulf Glider", "Howlin Tornado", "S...
## $ serial_no         <chr> "SV024", "GS-11-10-WG-14", "0643-C1-T1-TN60"...
## $ gender            <chr> "F", "F", "F", "F", "F", "F", "F", "M", "M",...
## $ age               <chr> "37", "43", "n/a", "51", "17", "40", "36", "...
## $ body_part         <chr> "Mouth", "Knee", "Right Shoulder", "Lower Le...
## $ alleged_injury    <chr> "Student hit mouth on wall", "Alleged arthro...
## $ cause_of_injury   <chr> "Student attempted unfamiliar manuever", "Hi...
## $ other             <chr> NA, "Prior history of problems with this kne...
Let’s create the barplot.
tx_injuries %>%
  select(alleged_injury) %>%
  unnest_tokens("word", alleged_injury) %>%
  anti_join(stop_words) %>%
  count(word, sort = TRUE) %>%
  mutate(word = reorder(word,n)) %>%
  filter(word != 'NA') %>%
  top_n(10, n) %>%
  ggplot(aes(word, n)) +
  geom_col(fill = "darkred") +
  labs(title = "Most frequent words in alleged injury reports at amusement parks",
       x = "Count",
       y = "Word") +
  scale_y_continuous(expand = c(0,0)) +
  coord_flip() +
  theme_minimal() +
  theme(
    panel.grid.major.y = element_blank(),
    plot.title = element_text(hjust = -.6,
                              color = "darkslategrey"),
    axis.text = element_text(color = 'darkslategrey'),
    axis.title = element_text(color = 'darkslategrey')
  )