Tidy Tuesday 03/09/2019 Moore’s Law
Data description
From From TidyTuesdays github:
This week’s data is from Wikipedia - by way of the Data Is Beautiful Subreddit.
Additional info and graphics can be found at Our World in Data.
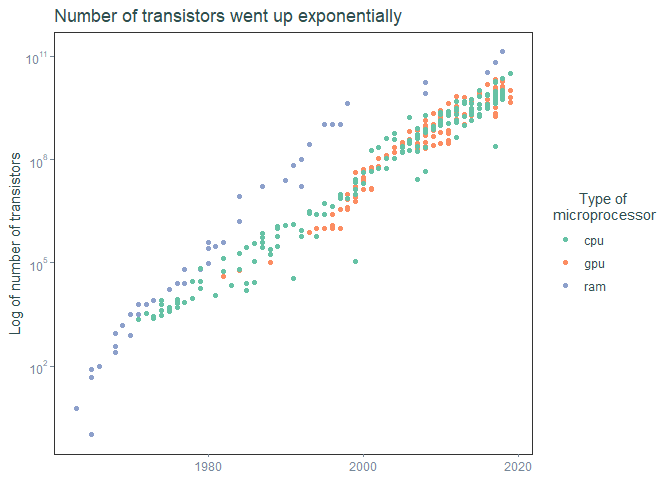
Moore’s Law: Transistors per microprocessor:
The observation that the number of transistors in a dense integrated circuit doubles approximately every two years.
Import data and packages
library(tidyverse)
library(scales)

cpu <- readr::read_csv("https://raw.githubusercontent.com/rfordatascience/tidytuesday/master/data/2019/2019-09-03/cpu.csv")

gpu <- readr::read_csv("https://raw.githubusercontent.com/rfordatascience/tidytuesday/master/data/2019/2019-09-03/gpu.csv")

ram <- readr::read_csv("https://raw.githubusercontent.com/rfordatascience/tidytuesday/master/data/2019/2019-09-03/ram.csv")
Let’s see number of transistors over time.
ggplot(mapping = aes(date_of_introduction, transistor_count)) +
  geom_point(data = ram, aes(color = 'ram')) +
  geom_point(data = gpu, aes(color = 'gpu')) +
  geom_point(data = cpu, aes(color = 'cpu')) +
  labs(
    title = "Number of transistors went up exponentially",
    y = "Log of number of transistors",
    color = "Type of \nmicroprocessor"
    ) +
  scale_y_log10(labels = trans_format("log10", math_format(10^.x))) +
  scale_colour_brewer(palette = 'Set2') +
  theme_bw() +
  theme(
        title = element_text(colour = "darkslategrey"),
        legend.title = element_text(hjust = .5),
        panel.grid = element_blank(),
        legend.text = element_text(colour = "darkslategrey"),
        axis.ticks = element_line(color = 'lightslategrey'),
        axis.text = element_text(color = 'lightslategrey'),
        axis.line = element_blank(),
        axis.title.x = element_blank()
        )